On this page
Treatment summary
Highlights
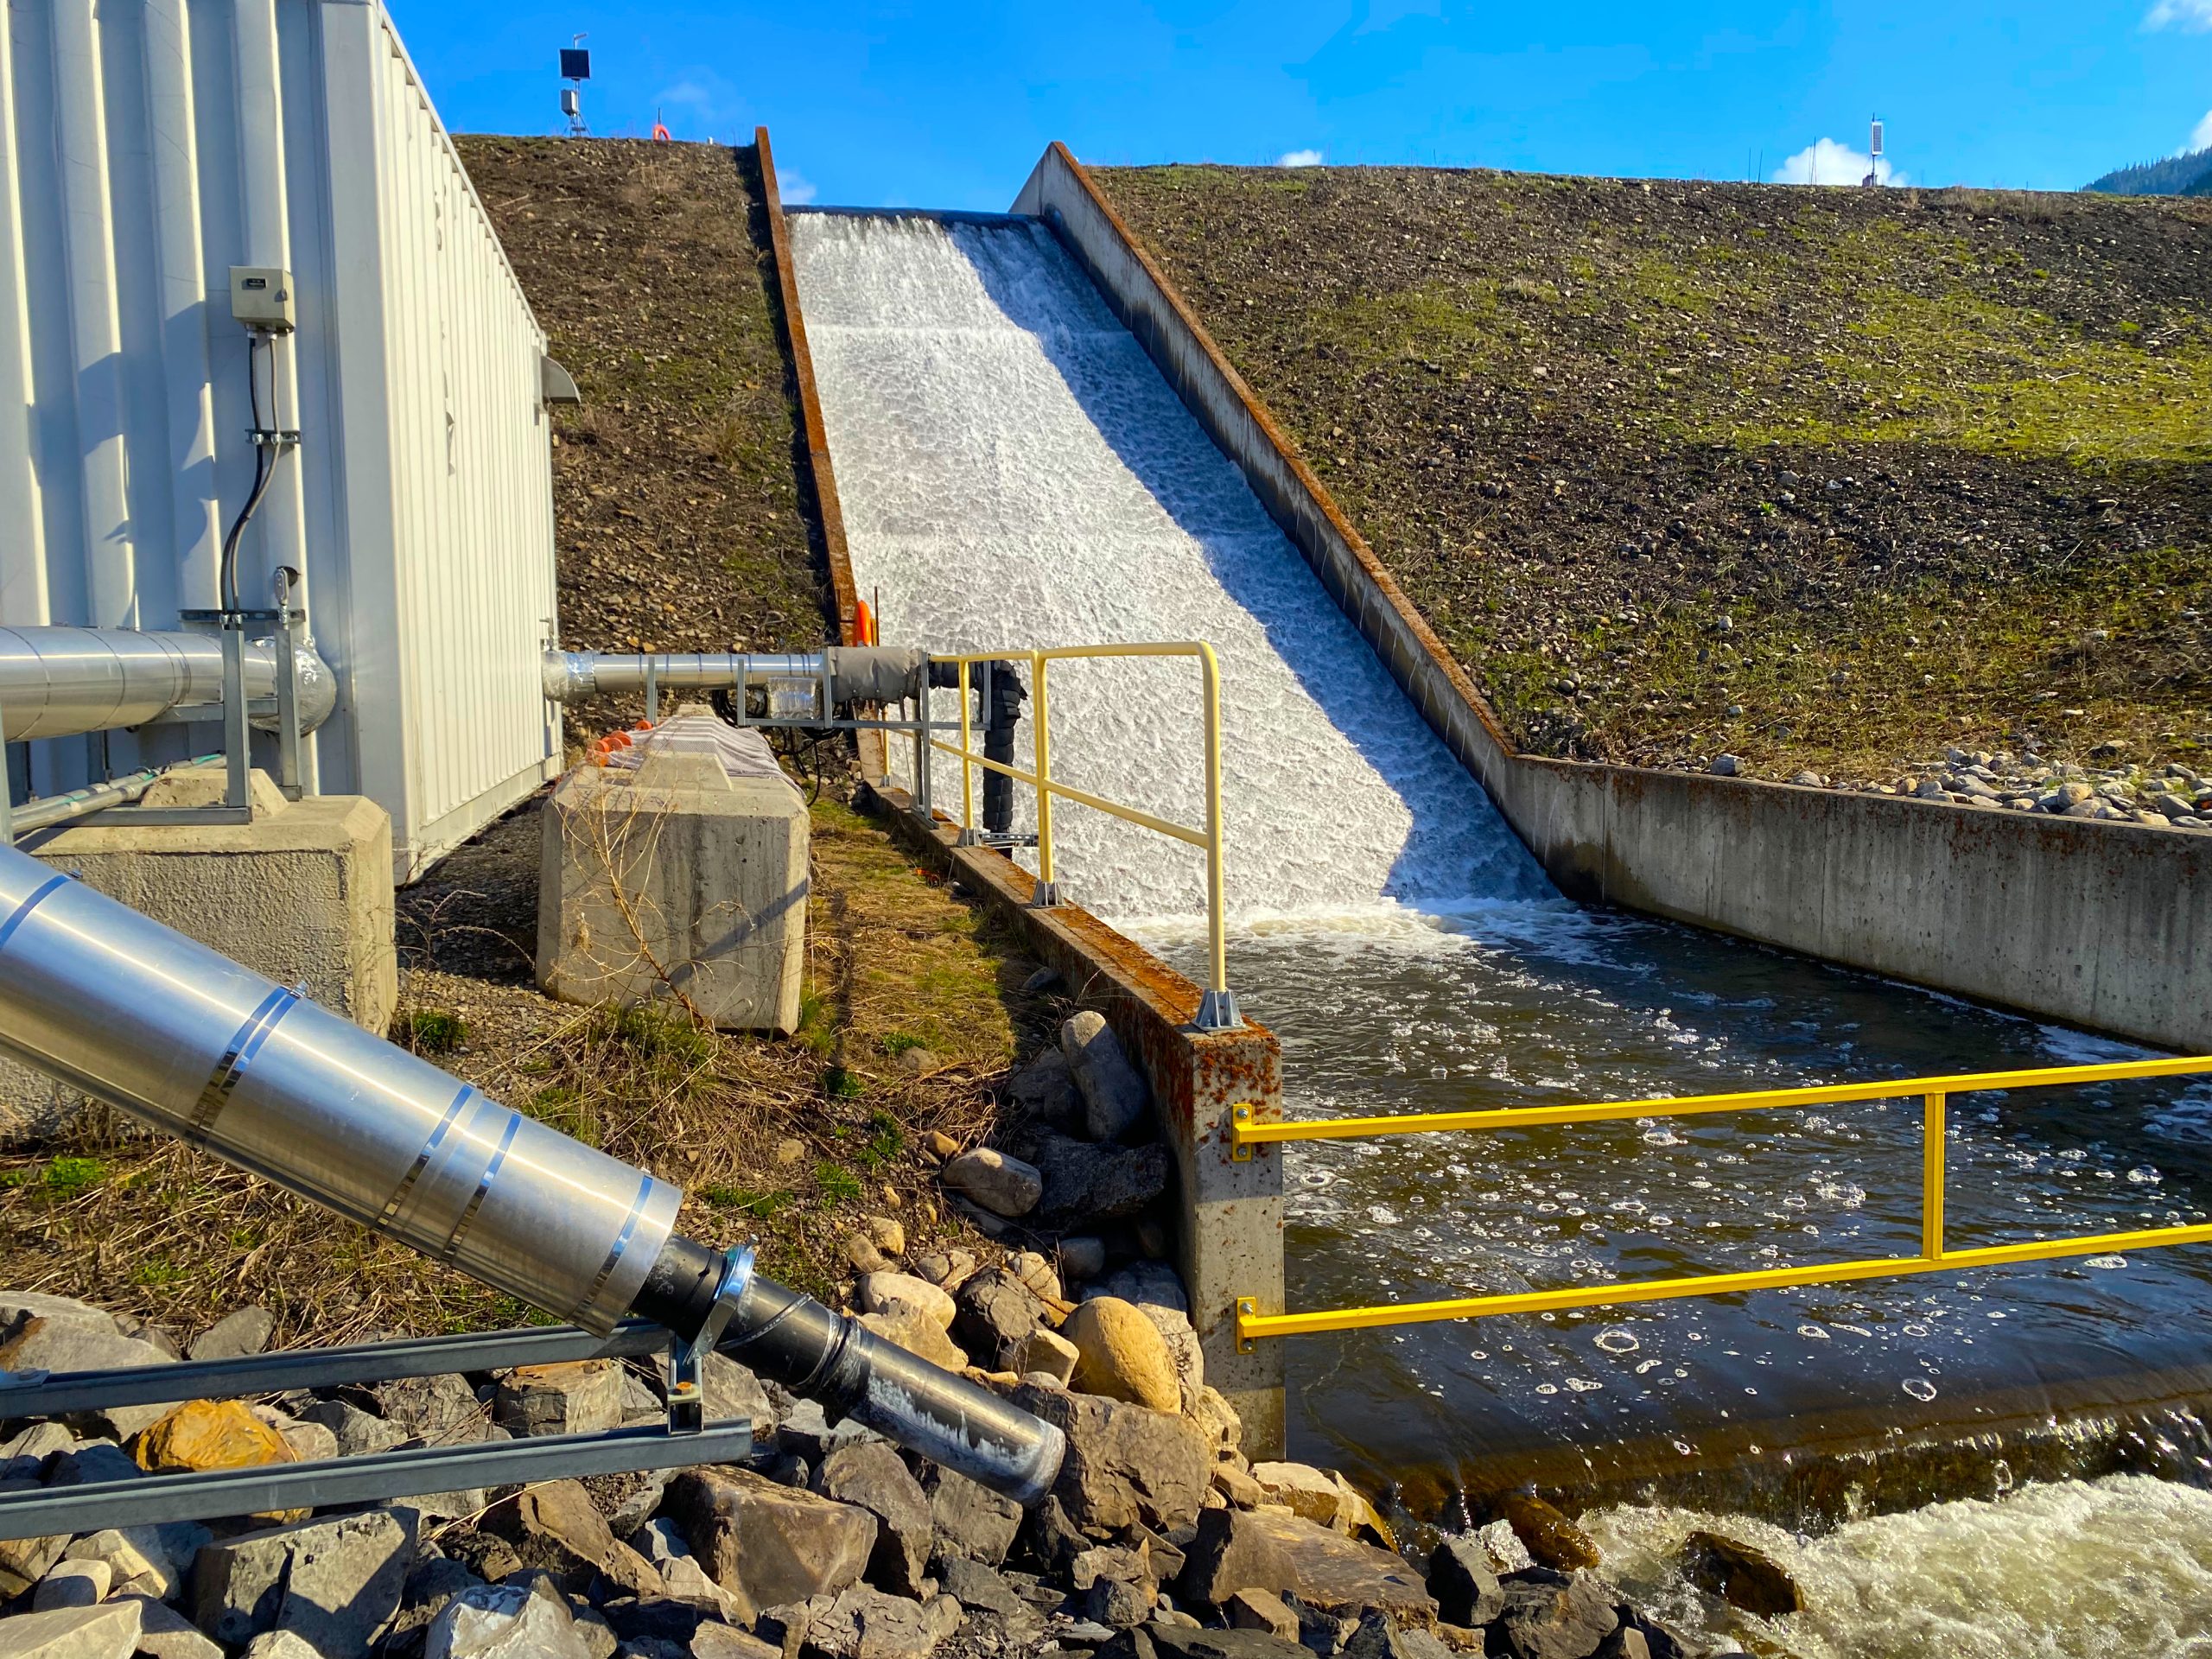
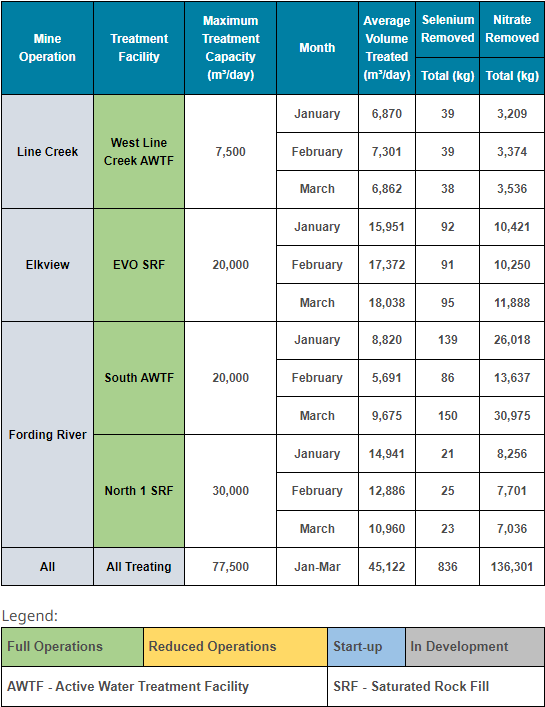
All four selenium and nitrate water treatment facilities in the Elk Valley were operating in January – March 2024 (Q1).
- The West Line Creek Active Water Treatment Facility (AWTF) treated slightly below its design capacity and operated 94% of time this quarter. Extreme cold temperatures in January, routine maintenance and minor facility upsets are the reasons why the facility treated slightly less than its full capacity.
- The Elkview Operations Saturated Rockfill (EVO SRF) treated at its design capacity for the first time and broke several facility records, including the most water treated in a day, a month and a quarter. This was accomplished despite the facility having to shut-down for periods in January (extreme cold) and February (mine-wide power outage) and reduce operations in March to keep the water temperature in Erickson Creek below permit limits. Overall, the facility’s pipelines operated on average 96% of the time this quarter.
- The Fording River South (FRO-S) AWTF treated an average of 8,000 m3/day this quarter, despite approximately 12,500 to 15,000 m3/day of mine-influenced water being available for treatment. Treatment at the facility was limited in January and March by periods of poor performance of the filter press and elevated ammonia generation. Treatment was severely limited between February 6th and March 2nd due to an error in re-filling the methanol tanks, which resulted in only 1/3 of the facility being able to operate during this period. When issues like these occur, EVR is required to notify the ministry and take corrective actions. Overall, the facility operated 91% of the time this quarter.
- The Fording River Operations North 1 Saturated Rock Fill (FRO-N1 SRF) treatment facility is the newest treatment facility, and this was its first full quarter of operations. The facility ran well and operated 98.5% of the time this quarter. EVR continues to focus on increasing the amount of water treated through the facility.
Now that the fourth treatment facility is operating, EVR treated 35% more water this quarter than during any previous quarter, operating at approximately 58% of total design capacity and running on average 95% of the time. In total, facilities removed 836 kg of selenium and 136,301 kg of nitrate. These totals are just slightly below the maximum removal amounts set in Q1 2023. Removal totals are expected to continue increasing with improved performance of the FRO-S AWTF and FRO-N1 SRF.
Treatment progress
Amount of selenium removed and remaining in the Elk River
Amount of nitrate removed and remaining in the Elk River
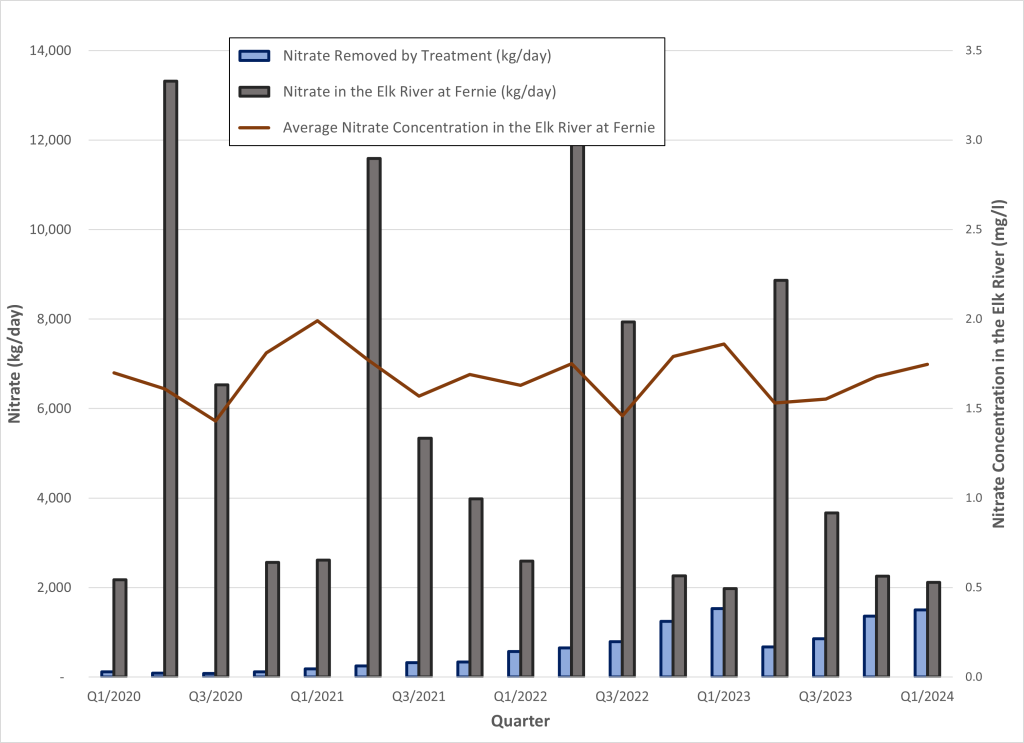
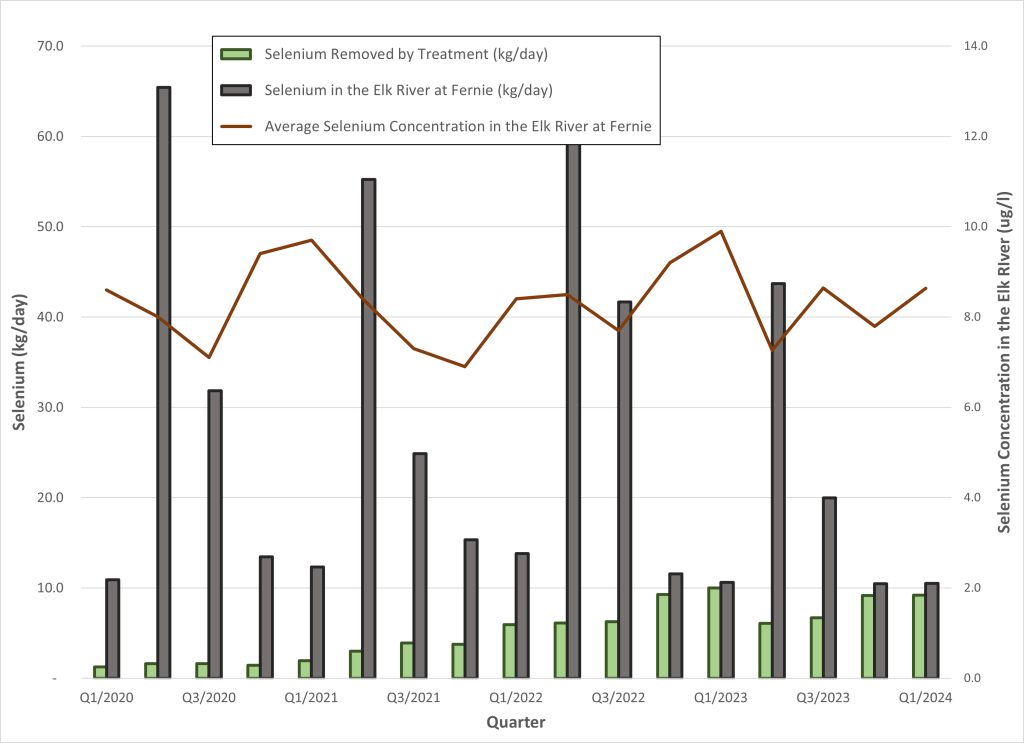
The graphs above show the total estimated amounts of selenium and nitrate that were in the Elk River at Fernie as grey bars, the average measured concentration of these substances in the river as red lines, and the amount of selenium (green bars) and nitrate (blue bars) removed by treatment, each quarter.
The substance amounts removed by treatment (green and blue bars) were similar to the previous quarter. This is because increased treatment at the EVO SRF and FRO-N1 SRF was offset by decreased treatment at FRO-S AWTF. The FRO-S AWTF treats the poorest quality water of all the facilities, and therefore removes more selenium and nitrate per volume of water treated. Consequently, there was only minimal change in total substance removal despite a 35% increase in treatment volume.
The substance amounts in the Elk River at Fernie are calculated from water quality data collected by EVR and flow data collected by the Water Survey of Canada. The amount of each substance varies with the amount of flow in the river. In general, the higher the flow the greater the amount, and vice-versa.


