On this page
Treatment summary
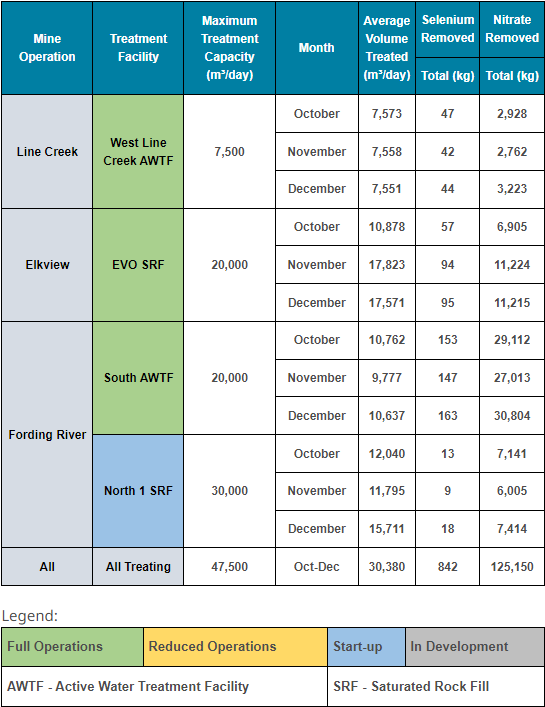
Fording River North 1 SRF statistics are not included in the totals at the bottom of this table (see discussion below)
Highlights
Three treatment facilities operated in October – December 2023 (Q4).
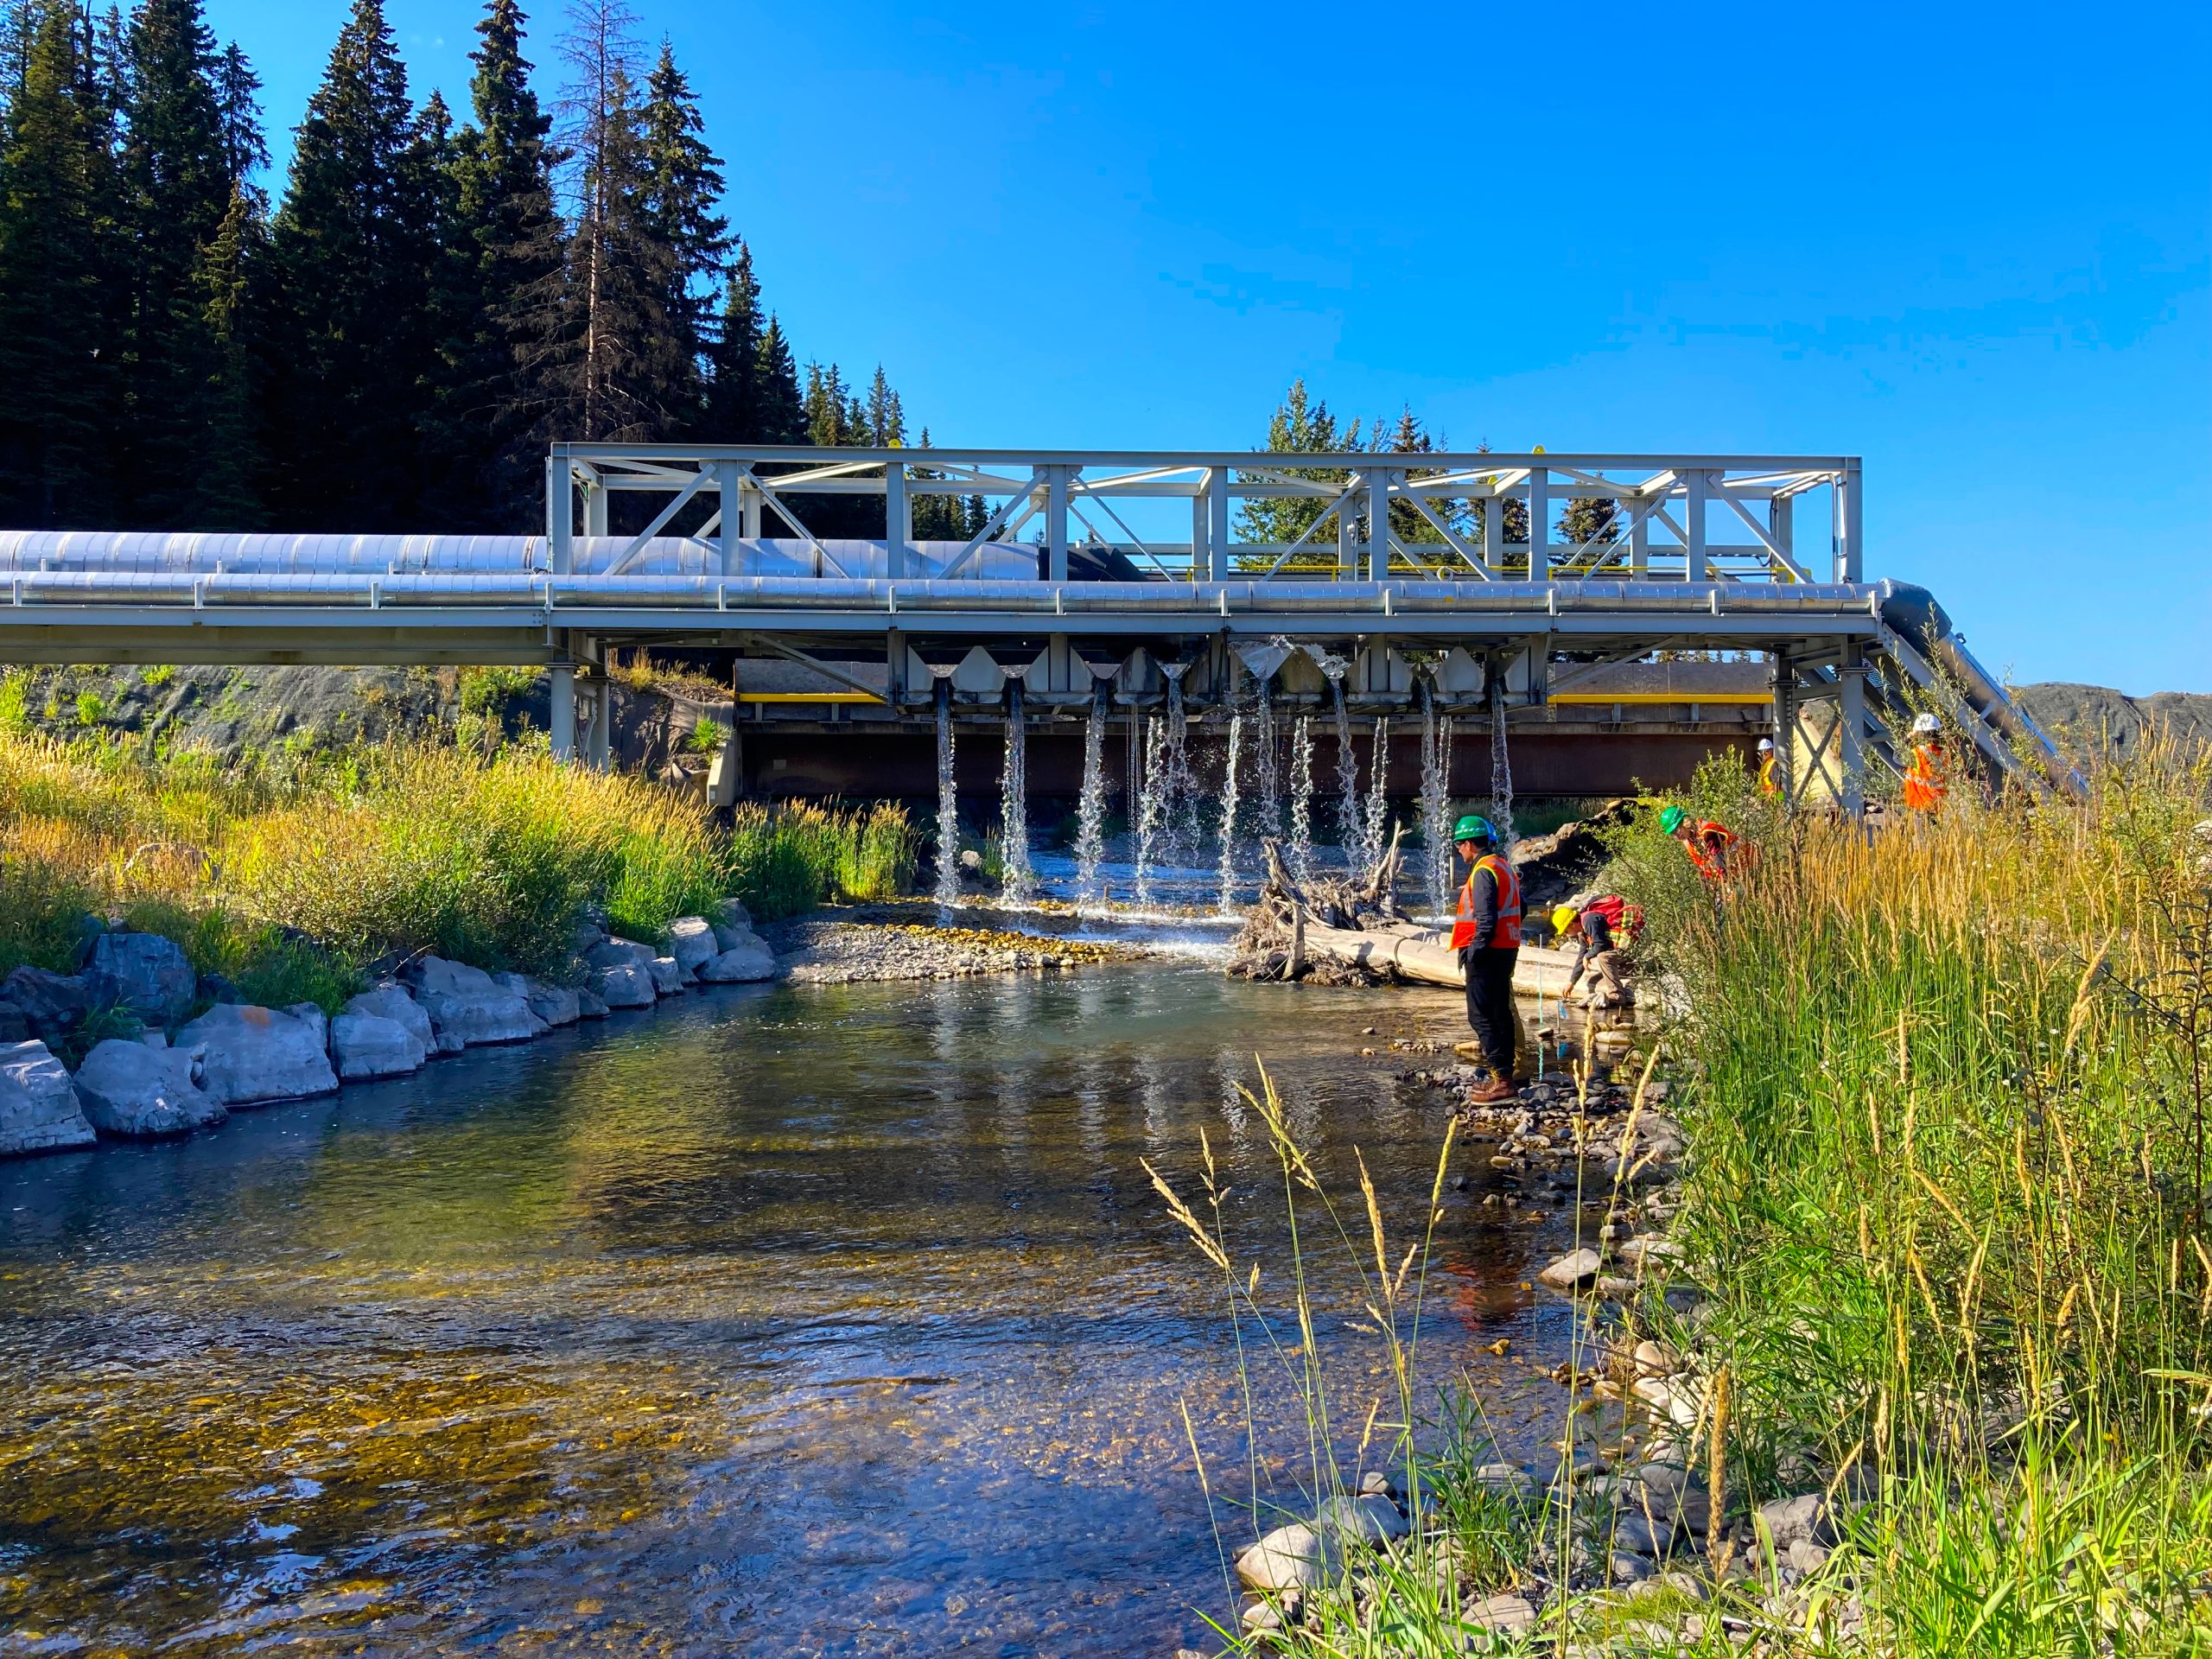
The West Line Creek Active Water Treatment Facility (AWTF), Elkview Operations Saturated Rock Fill (EVO SRF) and Fording River Operations South (FRO-S) AWTF all operated at greater capacity than the previous quarter.
- The West Line Creek AWTF treated slightly more water than its design capacity and operated 99.6% of time this quarter.
- The EVO SRF operated at slightly reduced capacity in early October to manage temperature below permit limits in Erickson Creek, and treatment was shut down in mid-October to relocate the influent pipelines. The facility operated without any major issues in November and December and recorded the two highest monthly average treatment volumes since it began operating. Overall, the facility’s two source pipelines operated on average 92% of the time this quarter.
- The FRO-S AWTF operated at approximately half of its flow capacity. Treatment at the facility was limited by periods of poor performance of the filter press and periods of maximum nitrate loads (also known as nitrate limits) in the source water. Operating at its nitrate limits means the facility cannot manage any additional nitrate, so the facility cannot treat any additional water even if flows are below the treatment capacity. Overall, the facility operated 95% of the time this quarter.
The Fording River Operations North 1 Saturated Rock Fill (FRO-N1 SRF) treatment facility is the fourth major treatment facility in the Elk Valley. It completed its start-up phase on December 10, 2023.
- By the end of this quarter the facility was treating more water that flows into the environment than water stored in mine pits. Because it wasn’t removing significant amounts of selenium and nitrate that would have otherwise flowed into the environment, the data in the summary table for this facility wasn’t used to calculate the total treatment amounts.
- As of December 20th the SRF is now treating all four of its primary sources and future summaries will include treatment statistics for this facility in the quarterly totals.
Overall, Elk Valley treatment facilities operated at approximately 70% of total potential capacity and were running on average 96% of the time this quarter. In total, facilities removed 842 kg of selenium and 125,150 kg of nitrate.
Treatment progress
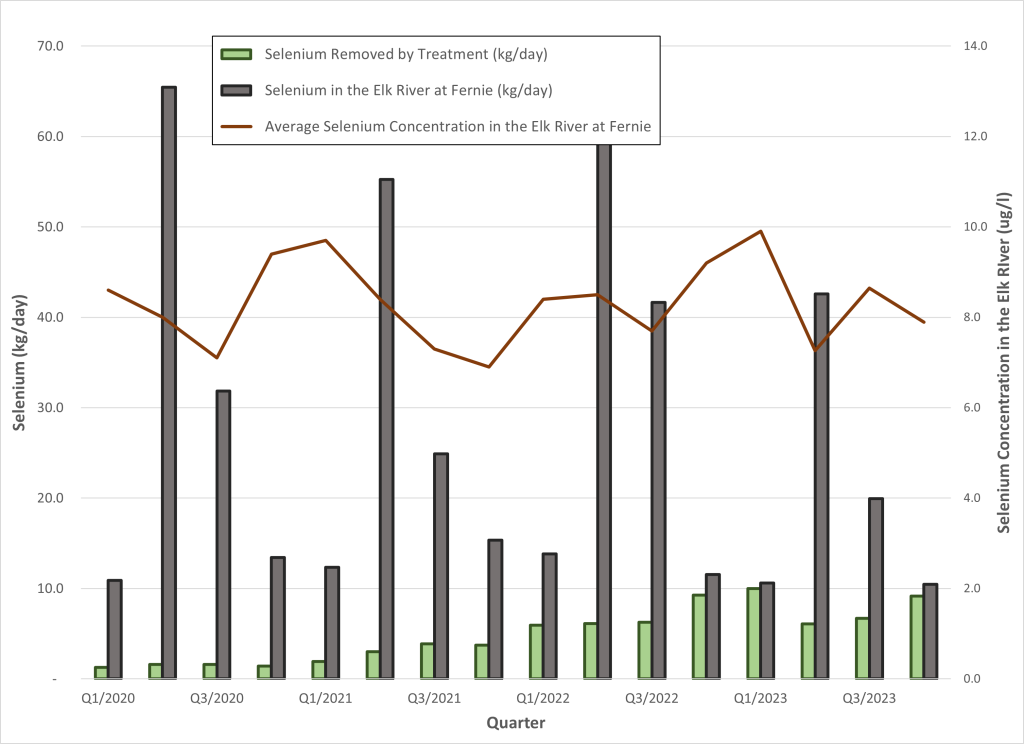
Amount of selenium removed and remaining in the Elk River
Amount of nitrate removed and remaining in the Elk River
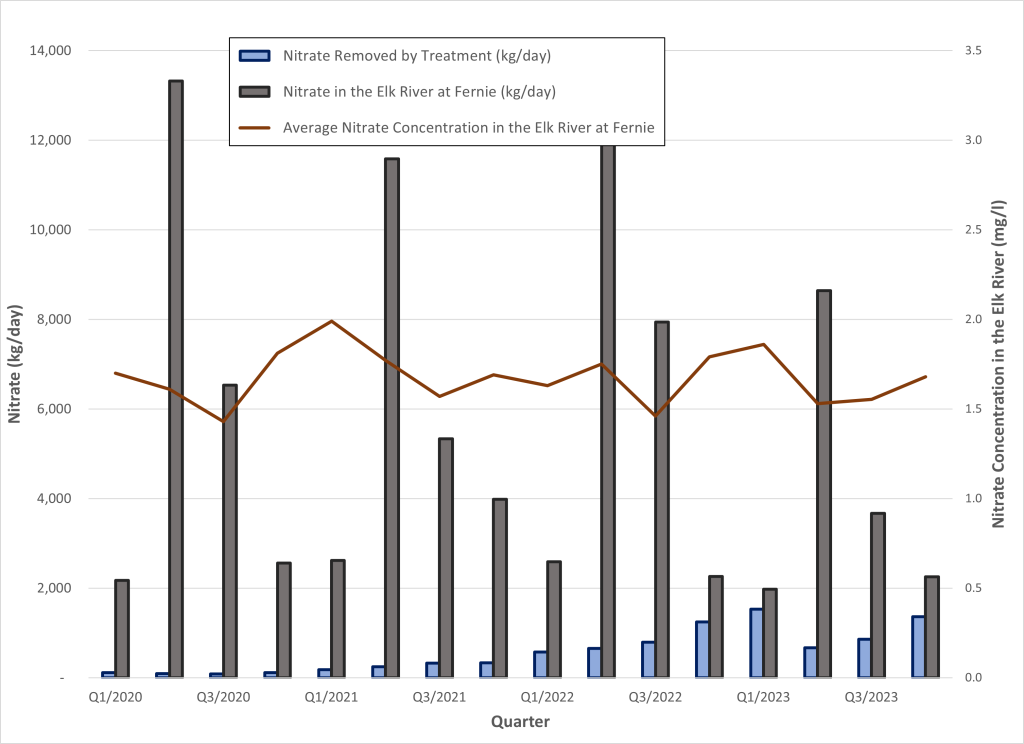
The graphs above show the total estimated amounts of selenium and nitrate that were in the Elk River at Fernie as grey bars, the average measured concentration of these substances in the river as red lines, and the amount of selenium (green bars) and nitrate (blue bars) removed by treatment, each quarter.
The substance amounts removed by treatment (green and blue bars) increased during the fourth quarter of 2023 primarily as a result the EVO SRF and LCO AWTF notably increasing treatment to at or close to their capacities. However, filter press performance and maximized nitrate capacity limited treatment at the FRO-S AWTF, resulting in less treatment than anticipated. An increase in treatment is expected in the first quarter of 2024 with the operation of the FRO-N1 SRF.
The substance amounts in the Elk River at Fernie are calculated from water quality data collected by EVR and flow data collected by the Water Survey of Canada. The amount of each substance varies with the amount of flow in the river. In general, the higher the flow the greater the amount, and vice-versa.


