On this page
Summary of water quality at select Order Stations
Average Monthly Selenium Concentration (ug/L)
| Order Station | Limit | January | February | March |
|---|---|---|---|---|
| Fording River Downstream of Greenhills Creek | 63 | 59 | 63 | 68 |
| Elk River Upstream of Grave Creek | 23 | 18 | 18 | 19 |
| Elk River Downstream of Michel Creek | 19 | 13 | 14 | 14 |
| Koocanusa Reservoir Downstream of the Elk River | 2 | 1.4 | 1.0 | 1.6 |
Average Monthly Nitrate Concentration (mg/L)
| Order Station | Limit | January | February | March |
|---|---|---|---|---|
| Fording River Downstream of Greenhills Creek | 14 | 14 | 15 | 16 |
| Elk River Upstream of Grave Creek | 4 | 3.9 | 4.4 | 4.4 |
| Elk River Downstream of Michel Creek | 3 | 2.6 | 2.7 | 2.7 |
| Koocanusa Reservoir Downstream of the Elk River | 3 | 0.35 | 0.30 | 0.32 |
Average Monthly Sulphate Concentration (mg/L)
| Order Station | Limit | January | February | March |
|---|---|---|---|---|
| Fording River Downstream of Greenhills Creek | 429 | 270 | 289 | 319 |
| Elk River Upstream of Grave Creek | 429 | 111 | 116 | 122 |
| Elk River Downstream of Michel Creek | 429 | 108 | 115 | 116 |
| Koocanusa Reservoir Downstream of the Elk River | 308 | 48 | 50 | 44 |
Notes:
- Cells highlighted yellow denote where the concentration exceeds the limit. Non-highlighted cells do not exceed the limit.
- Sites in the table represent a range of conditions in the Elk Valley from the Fording River downstream to the Elk River and finally Koocanusa Reservoir. Click the site name to view the entire datasets for these sites back to 2014 or visit the Water Quality Data Dashboard to view data from additional sites.
Highlights
The January through March period in the Elk River and its tributaries is the period of low winter streamflow.
- This is typically accompanied by the poorest water quality (highest concentrations of substances) of the year because reduced streamflow results in low dilution.
- Koocanusa Reservoir follows a similar seasonal trend. Water quality in the reservoir is also heavily influenced by the flow and quality of the Kootenay River which is the other main water source for the reservoir. Operations at Libby Dam in the United States further affect water levels and flows in the reservoir. The highest concentrations in the reservoir often occur in the early spring when water levels are at their lowest.
The water quality results from January – March 2023 followed the expected seasonal pattern.
- Water quality limits were exceeded in the Fording River in February and March. Nitrate limits were also exceeded in these months in the Elk River upstream of Grave Creek. The elevated Elk River values are caused by high nitrate levels in the Fording River and limited dilution from other water sources at this time of year. These exceedances were predicted by EVR’s latest models and were not unexpected.
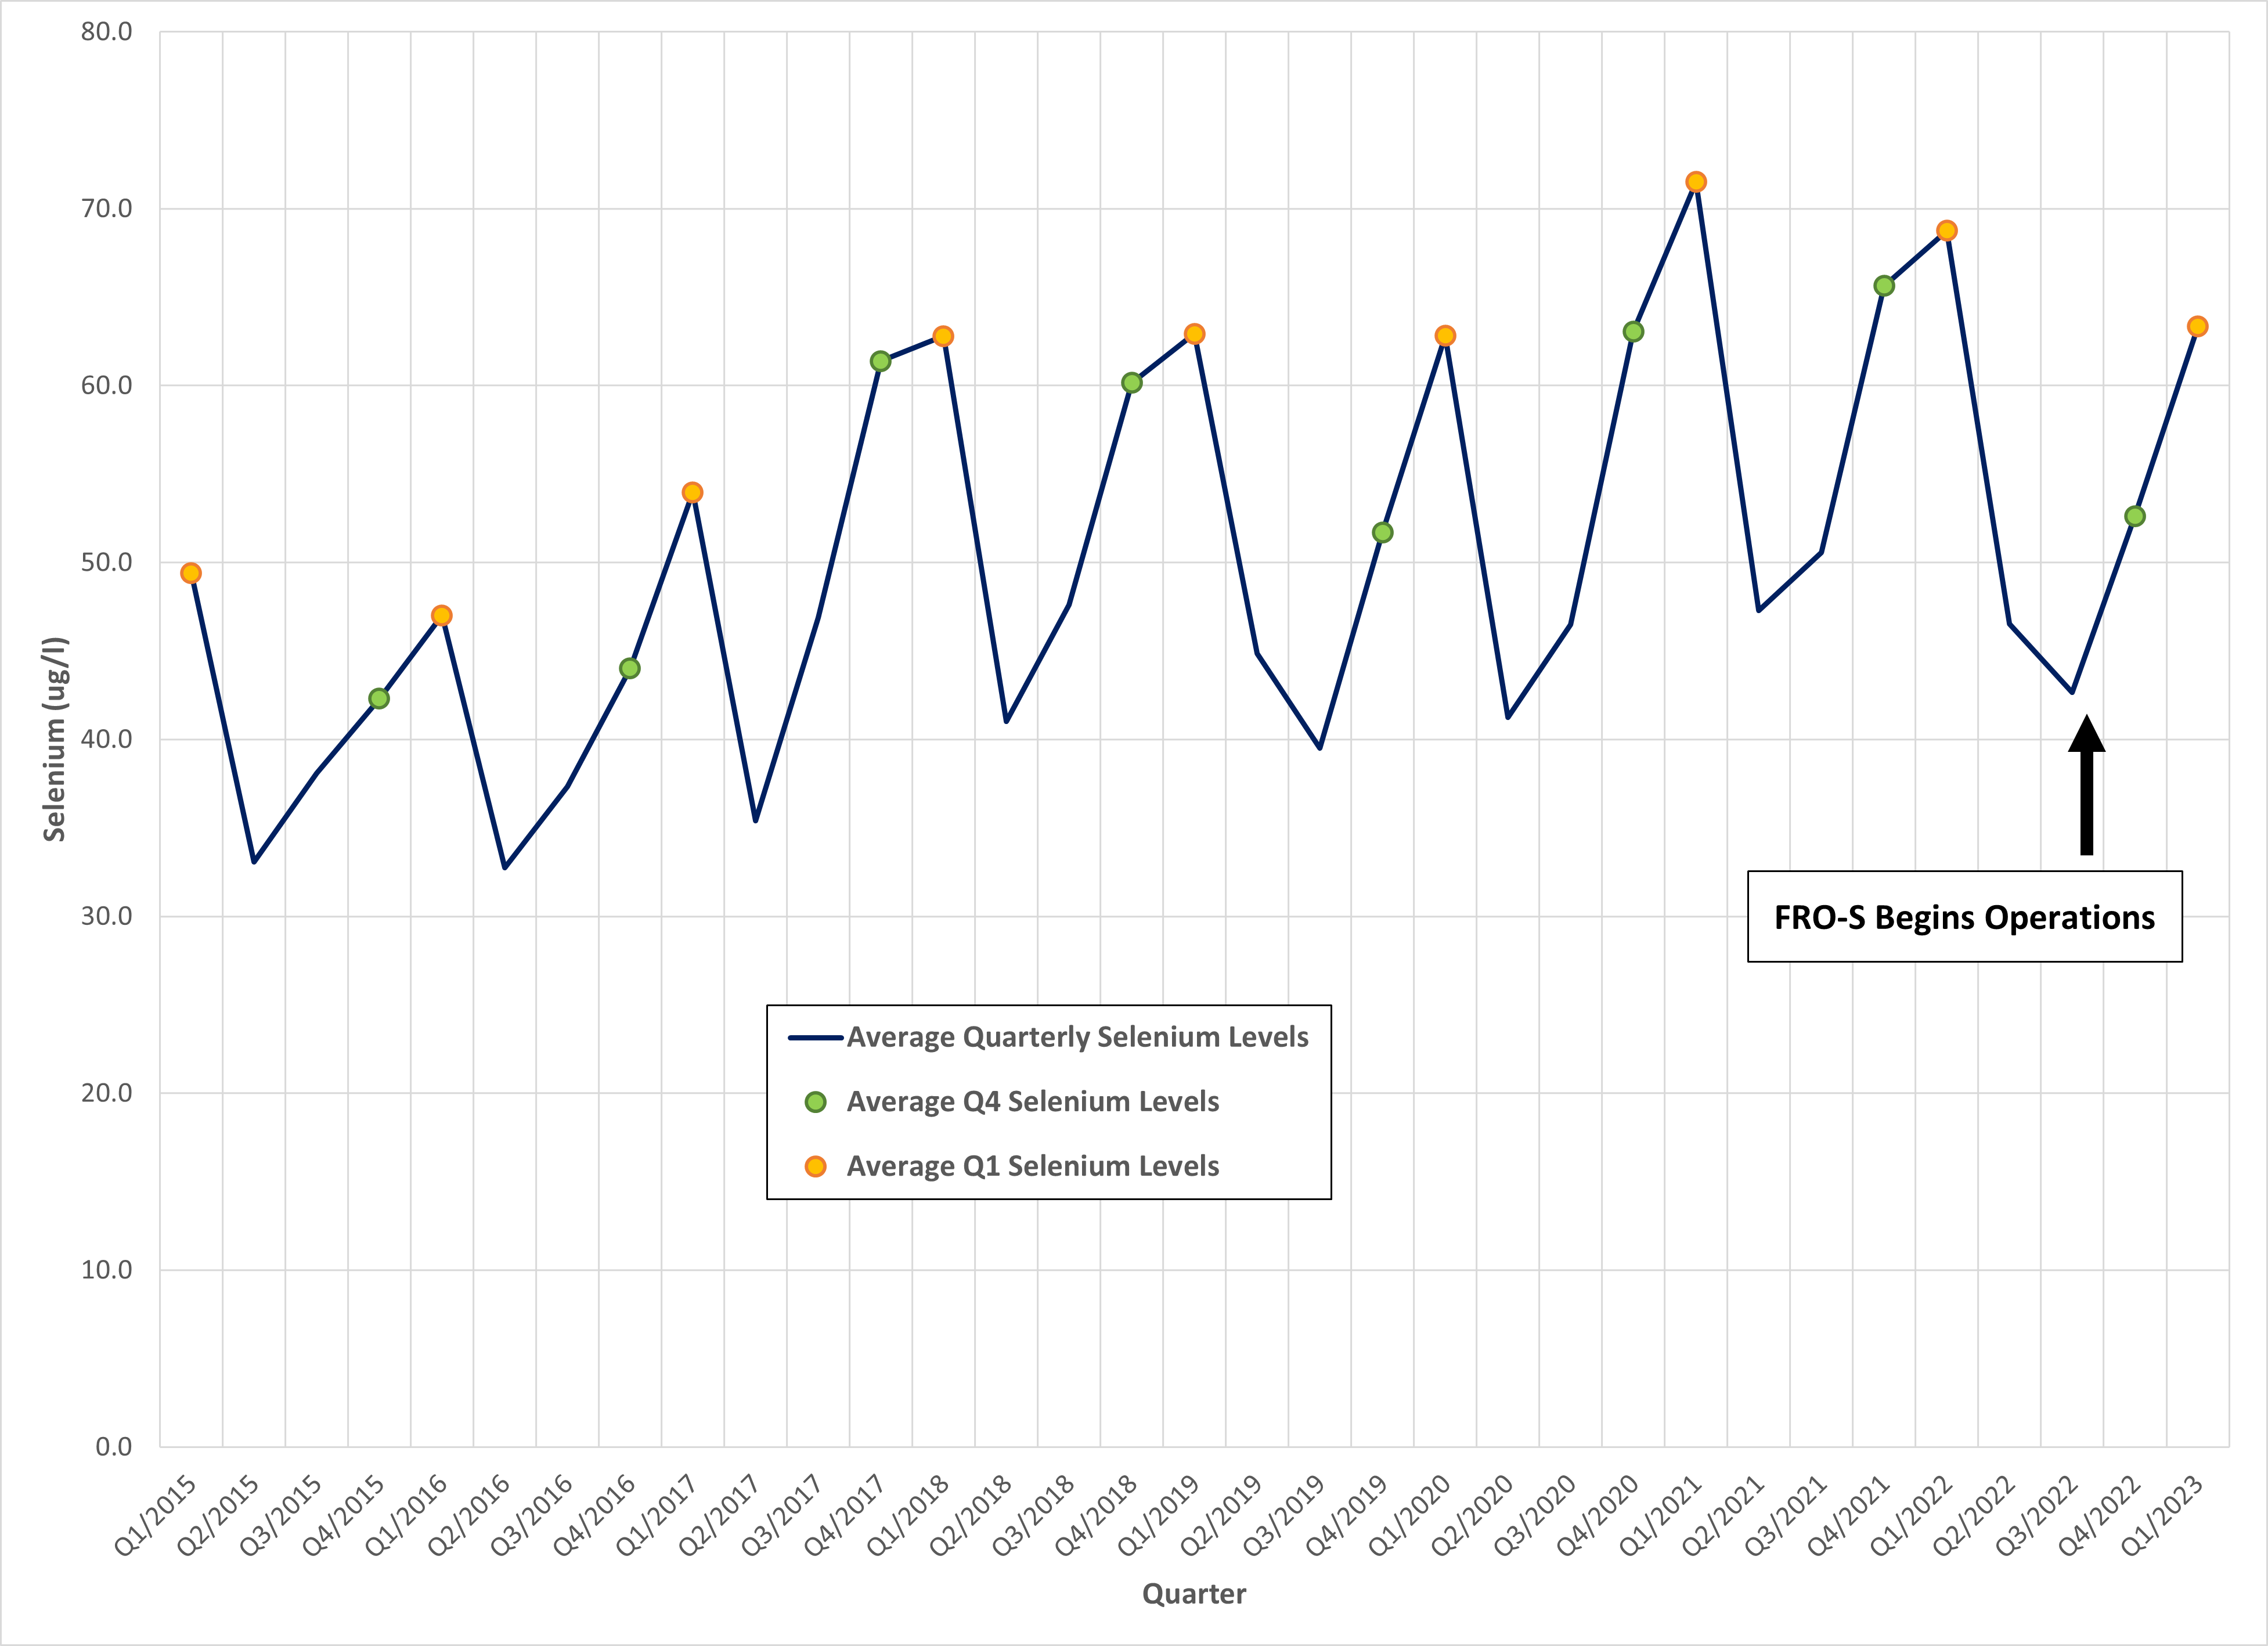
Selenium and nitrate concentrations in the Fording River are showing signs of stabilization and improvement, despite being above limits this quarter. As shown in the figure below, the Fording River South Active Water Treatment Facility (FRO-S AWTF) began operations in mid-2022. Since that time, both the Q4 2022 and Q1 2023 average selenium results show improvements from the previous two years. Based on the climate and streamflow of this past year, without the treatment facility we would have expected the concentrations to have been higher than were measured. These results are promising, and we expect water quality to continue to improve as substances slowly flush out of the ground and groundwater quality in the Fording River valley improves, and as additional treatment comes online.
Average quarterly selenium levels in the fording river
Visit the Water Quality Dashboard for current and historical water quality data at all Compliance Points, Order Stations and Trend Sites.
The potential for impacts resulting from water quality conditions are carefully monitored. Results of the monitoring programs are summarized each year in the Aquatic Ecosystem Health Annual Update.


