On this page
Summary of water quality at select Order Stations
Average Monthly Selenium Concentration (ug/L)
| Order Station | Limit | January | February | March |
|---|---|---|---|---|
| Fording River Downstream of Greenhills Creek | 57 | 57 | 64 | 60 |
| Elk River Upstream of Grave Creek | 19 | 19 | 18 | 20 |
| Elk River Downstream of Michel Creek | 19 | 12 | 11 | 13 |
| Koocanusa Reservoir Downstream of the Elk River | 2 | 1.1 | 1.0 | 1.2 |
Average Monthly Nitrate Concentration (mg/L)
| Order Station | Limit | January | February | March |
|---|---|---|---|---|
| Fording River Downstream of Greenhills Creek | 11 | 13.8 | 13.1 | 14.1 |
| Elk River Upstream of Grave Creek | 4 | 4.3 | 3.9 | 4.7 |
| Elk River Downstream of Michel Creek | 3 | 2.2 | 2.1 | 2.5 |
| Koocanusa Reservoir Downstream of the Elk River | 3 | 0.31 | 0.28 | 0.31 |
Average Monthly Sulphate Concentration (mg/L)
| Order Station | Limit | January | February | March |
|---|---|---|---|---|
| Fording River Downstream of Greenhills Creek | 429 | 313 | 321 | 341 |
| Elk River Upstream of Grave Creek | 429 | 129 | 125 | 146 |
| Elk River Downstream of Michel Creek | 429 | 113 | 108 | 121 |
| Koocanusa Reservoir Downstream of the Elk River | 308 | 45 | 44 | 46 |
Notes:
- Cells highlighted yellow denote where the concentration exceeds the limit. Non-highlighted cells do not exceed the limit.
- Sites in the table represent a range of conditions in the Elk Valley from the Fording River downstream to the Elk River and finally Koocanusa Reservoir. Click the site name to view the entire datasets for these sites back to 2014 or visit the Water Quality Data Dashboard to view data from additional sites.
Highlights
The January through March period in the Elk River and its tributaries is the period of low winter streamflow. Flows are almost entirely a result of groundwater discharging to the streams.
- This period of low flows is typically accompanied by the poorest water quality (highest concentration of substances) of the year. Waste rock piles, which are the main source of most mine-related substances in the Elk Valley, store water during wet periods and then release it slowly over time. This means the piles are still releasing mine-impacted water when there’s not a lot of water in the streams to dilute the substances. The result is higher concentrations downstream from waste rock piles.
- Koocanusa Reservoir follows a similar seasonal trend. Water quality in the reservoir is also influenced by the flow and quality of the Kootenay River and operations at Libby Dam in the United States.
The water quality results from January to March 2024 generally followed the expected seasonal pattern, with concentrations being slightly higher than the previous quarter at most locations. However, average concentrations during Q1 were not as high as in previous years, even though mining in the Elk Valley is continuing and concentrations should therefore be increasing. This is because upstream water treatment has stopped concentrations from increasing and is now starting to reduce the maximum winter concentrations. This is evident in the monitoring data in the graph below. The data are showing that water treatment is working to reduce the maximum concentration of selenium (and nitrate) in the Fording and Elk rivers.
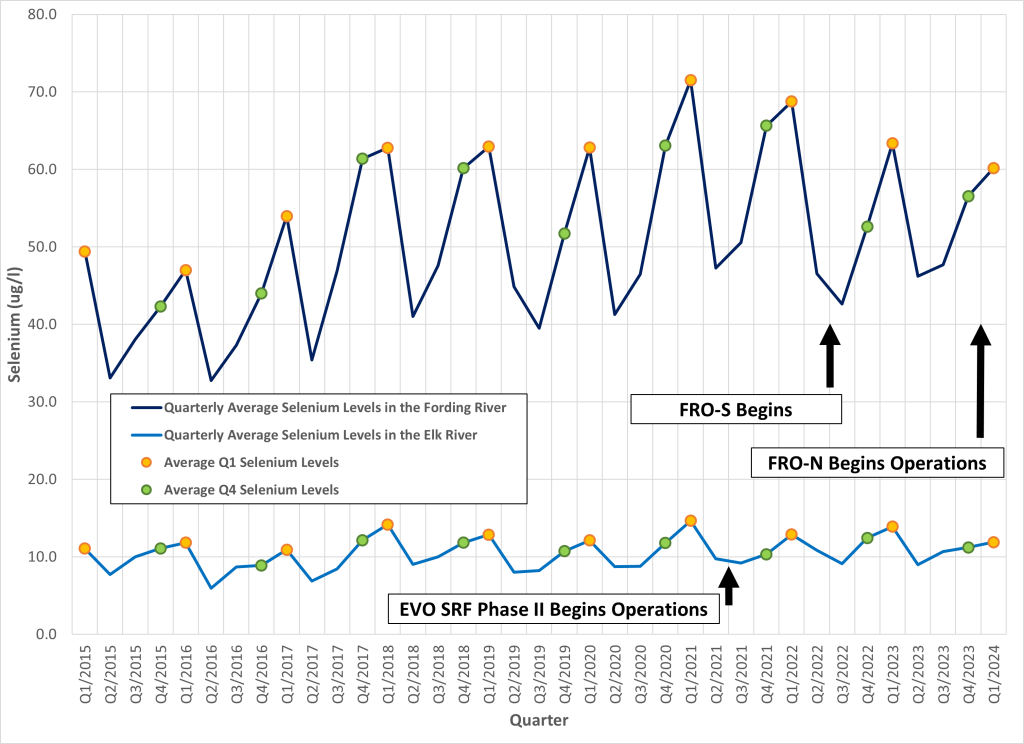
Despite the improving trend there were several water quality target exceedances in Q1 2024. Many of the exceedances occurred because the targets themselves were lowered in accordance with the Elk Valley Water Quality Plan. For example, five of the eight exceedances highlighted in the summary table occurred because the selenium and nitrate targets were lowered at “Fording River Downstream of Greenhills Creek” and the selenium target was lowered at “Elk River Upstream of Grave Creek”. These exceedances highlight that, while conditions are improving, they are not improving as quickly as anticipated in the 2014 version of the Elk Valley Water Quality Plan. This is because results of ongoing monitoring and research have required updates to models and the treatment strategy. These updates ensure long-term targets will be met, but also mean it will take a bit longer to meet them.
Overall, average nitrate and selenium levels in Q1 2024, in the Fording River and Elk River below Michel Creek, were generally lower than similar measurements from previous years.
Visit the Water Quality Dashboard for current and historical water quality data at all Compliance Points, Order Stations and Trend Sites.
The potential for impacts resulting from water quality conditions are carefully monitored. Results of the monitoring programs are summarized each year in the Aquatic Ecosystem Health Annual Update.


