On this page
Summary of water quality at select Order Stations
Average Monthly Selenium Concentration (ug/L)
| Order Station | Limit | October | November | December |
|---|---|---|---|---|
| Fording River Downstream of Greenhills Creek | 63 | 51 | 53 | 54 |
| Elk River Upstream of Grave Creek | 23 | 15 | 14 | 17 |
| Elk River Downstream of Michel Creek | 19 | 12 | 12 | 13 |
| Koocanusa Reservoir Downstream of the Elk River | 2 | 1.3 | 1.3 | 1.8 |
Average Monthly Nitrate Concentration (mg/L)
| Order Station | Limit | October | November | December |
|---|---|---|---|---|
| Fording River Downstream of Greenhills Creek | 14 | 13 | 13 | 13 |
| Elk River Upstream of Grave Creek | 4 | 3.3 | 3.3 | 3.8 |
| Elk River Downstream of Michel Creek | 3 | 2.4 | 2.4 | 2.4 |
| Koocanusa Reservoir Downstream of the Elk River | 3 | 0.21 | 0.20 | 0.33 |
Average Monthly Sulphate Concentration (mg/L)
| Order Station | Limit | October | November | December |
|---|---|---|---|---|
| Fording River Downstream of Greenhills Creek | 429 | 233 | 255 | 249 |
| Elk River Upstream of Grave Creek | 429 | 86 | 93 | 106 |
| Elk River Downstream of Michel Creek | 429 | 93 | 101 | 105 |
| Koocanusa Reservoir Downstream of the Elk River | 308 | 29 | 32 | 39 |
Notes:
- Cells highlighted yellow denote where the concentration exceeds the limit. Non-highlighted cells do not exceed the limit.
- Sites in the table represent a range of conditions in the Elk Valley from the Fording River downstream to the Elk River and finally Koocanusa Reservoir. Click the site name to view the entire datasets for these sites back to 2014 or visit the Water Quality Data Dashboard to view data from additional sites.
Highlights
The October through December period in the Elk River and its tributaries is typically a period of low and declining streamflow. Flows are mostly coming from groundwater, plus occasional rainstorms.
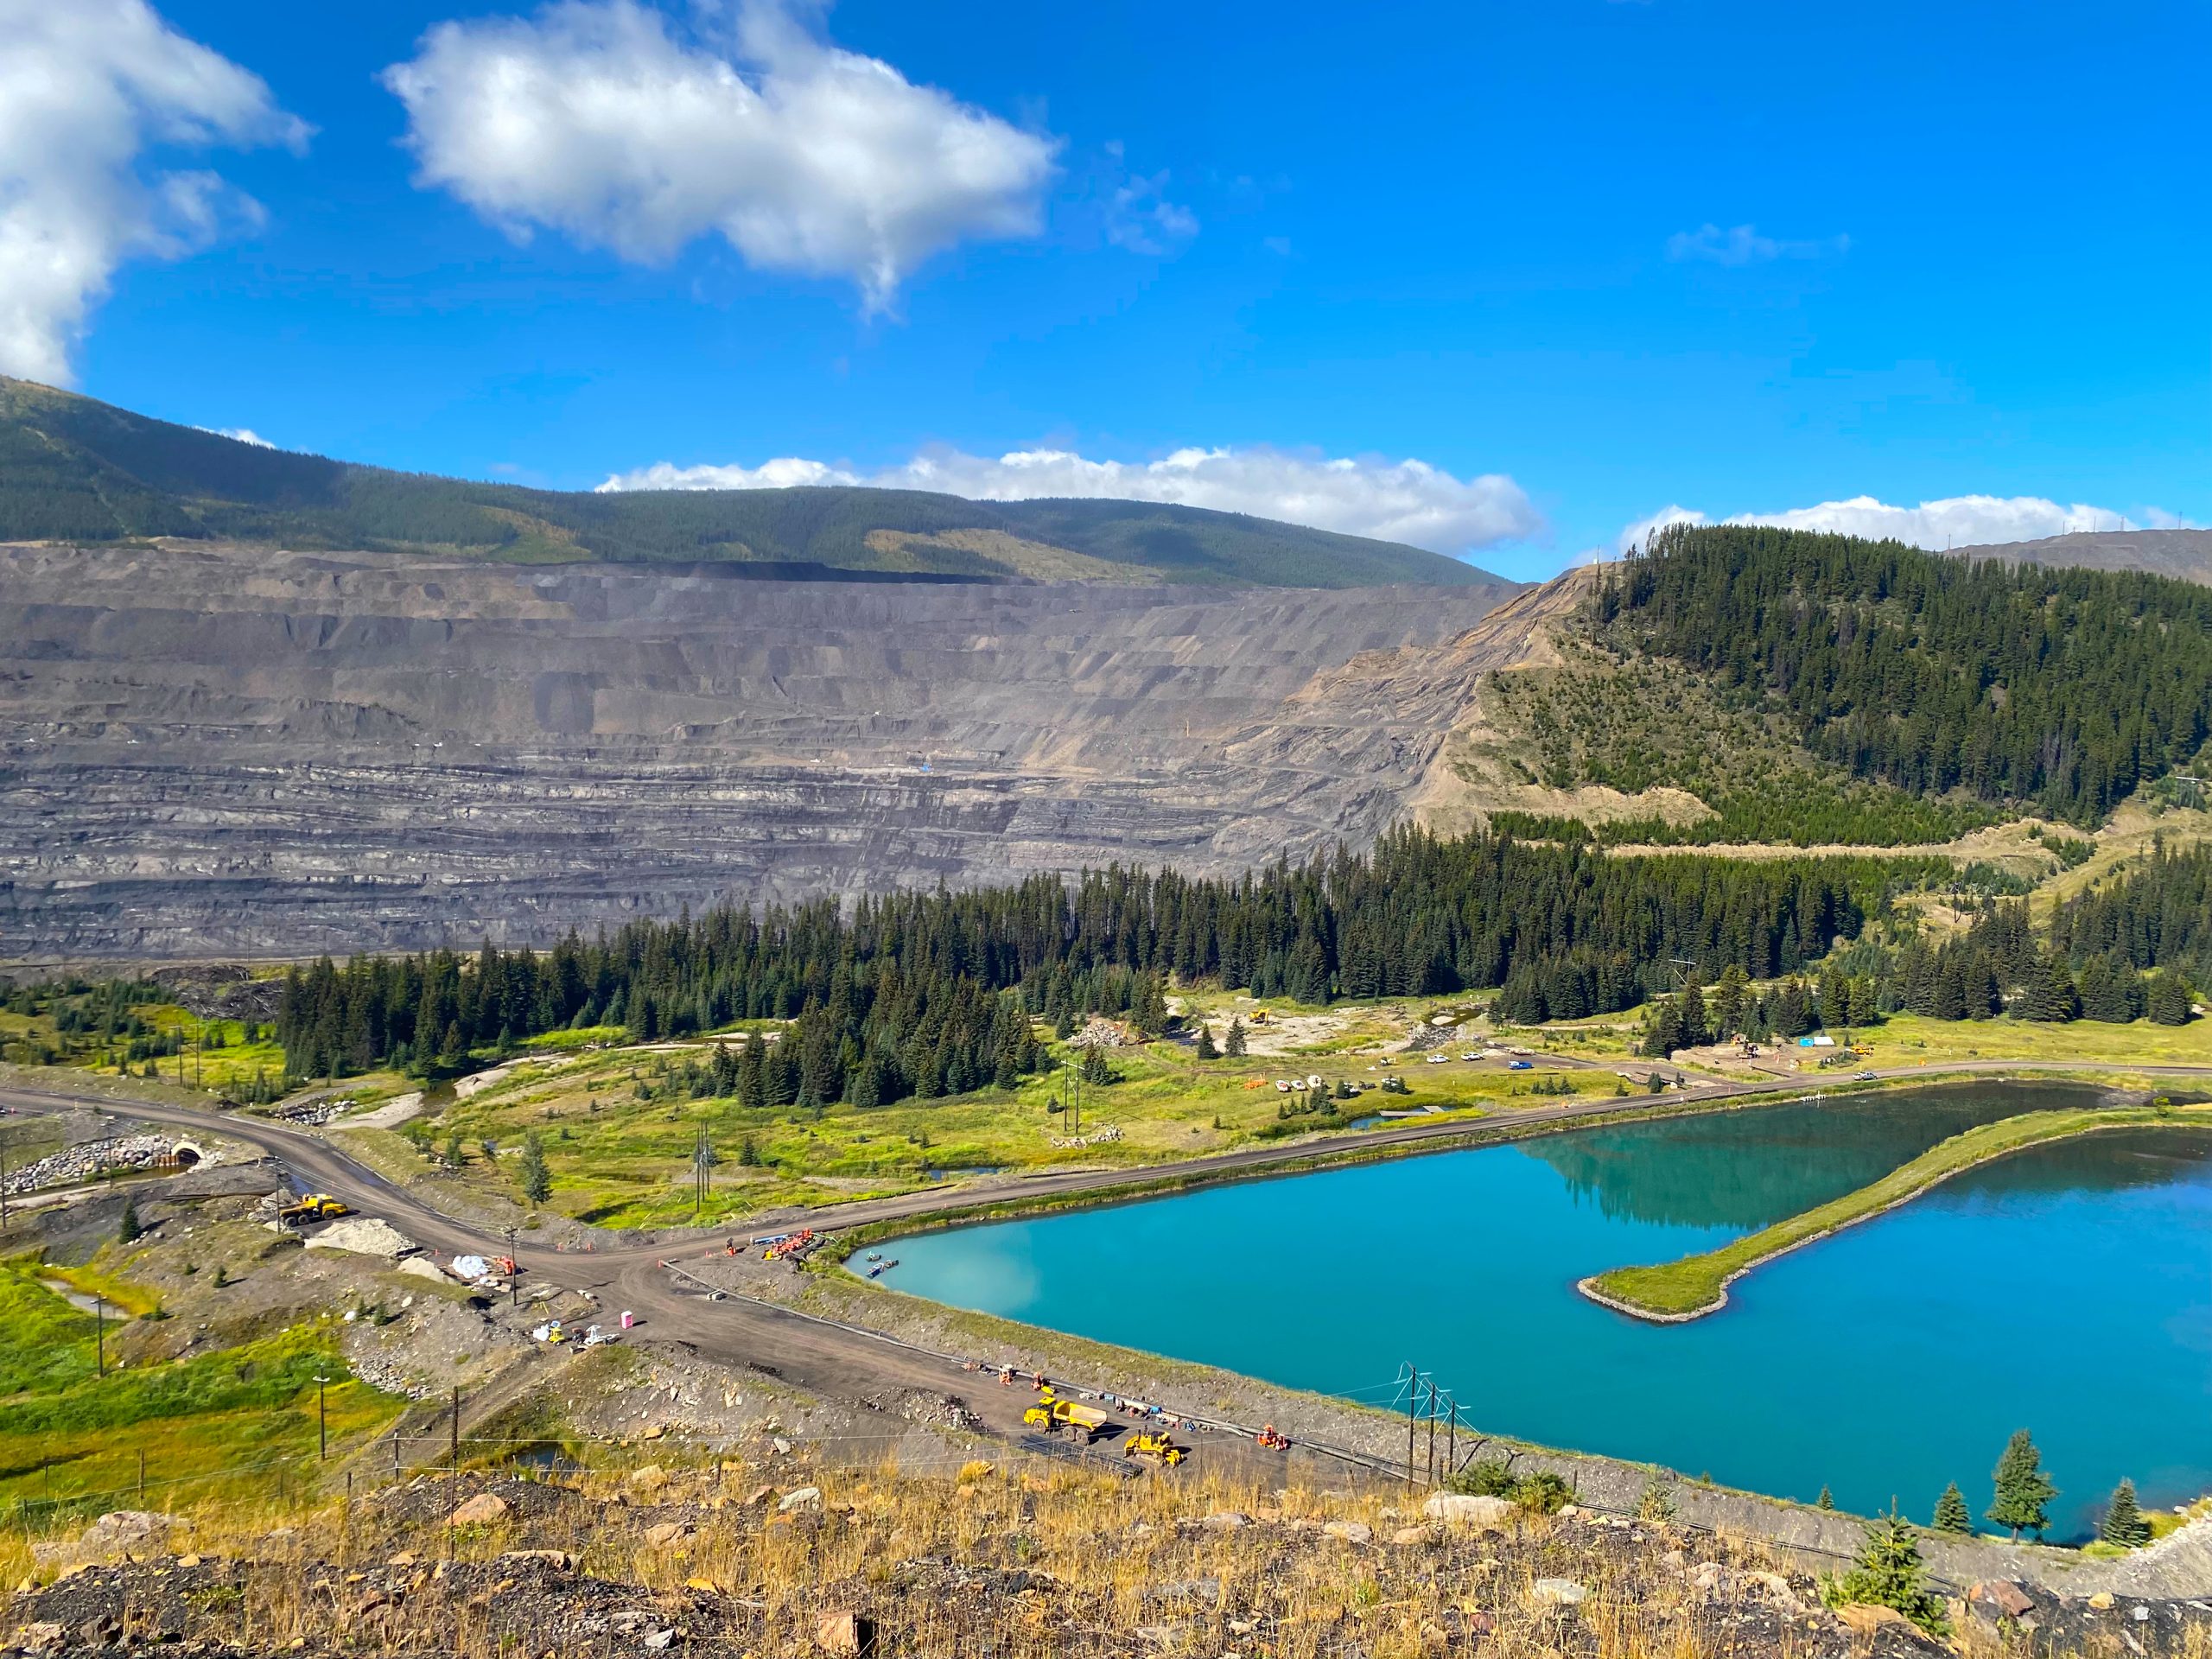
- As the flows decrease the concentrations of mining-related substances in the water increases. Waste rock piles, which are the main source of most mine-related substances in the Elk Valley, store water during wet periods and then release it slowly over time. This means the piles are still releasing mine-impacted water even where there’s not of lot of water in the streams to dilute the substances. The result is higher concentrations downstream from waste rock piles.
- Koocanusa Reservoir follows a similar seasonal trend. Water quality in the reservoir is also influenced by the flow and quality of the Kootenay River and operations at Libby Dam in the United States.
The water quality results from October to December 2023 generally followed the expected seasonal pattern in the Fording River.
However, water quality in the Elk River was relatively stable throughout the quarter upstream of Michel Creek, and it improved downstream of Michel Creek. This trend may reflect an approximate 17% increase in total selenium and nitrate removed by treatment from October to December including a 65% increase in treatment between October and November at the Elkview Operations Saturated Rock Fill in the Michel Creek watershed. Dilution from a large rainfall event in early December also likely contributed to slightly lower concentrations in that month.
Overall, average nitrate and selenium levels in Q4 2023 were moderate, with higher and lower average levels occurring twice, respectively, over the past five fourth quarters (2019-2023).
Nitrate and selenium displayed a similar pattern of stable to slightly improving concentrations in Koocanusa Reservoir.
Visit the Water Quality Dashboard for current and historical water quality data at all Compliance Points, Order Stations and Trend Sites.
The potential for impacts resulting from water quality conditions are carefully monitored. Results of the monitoring programs are summarized each year in the Aquatic Ecosystem Health Annual Update.


